![[Experimental]](figures/lifecycle-experimental.svg)
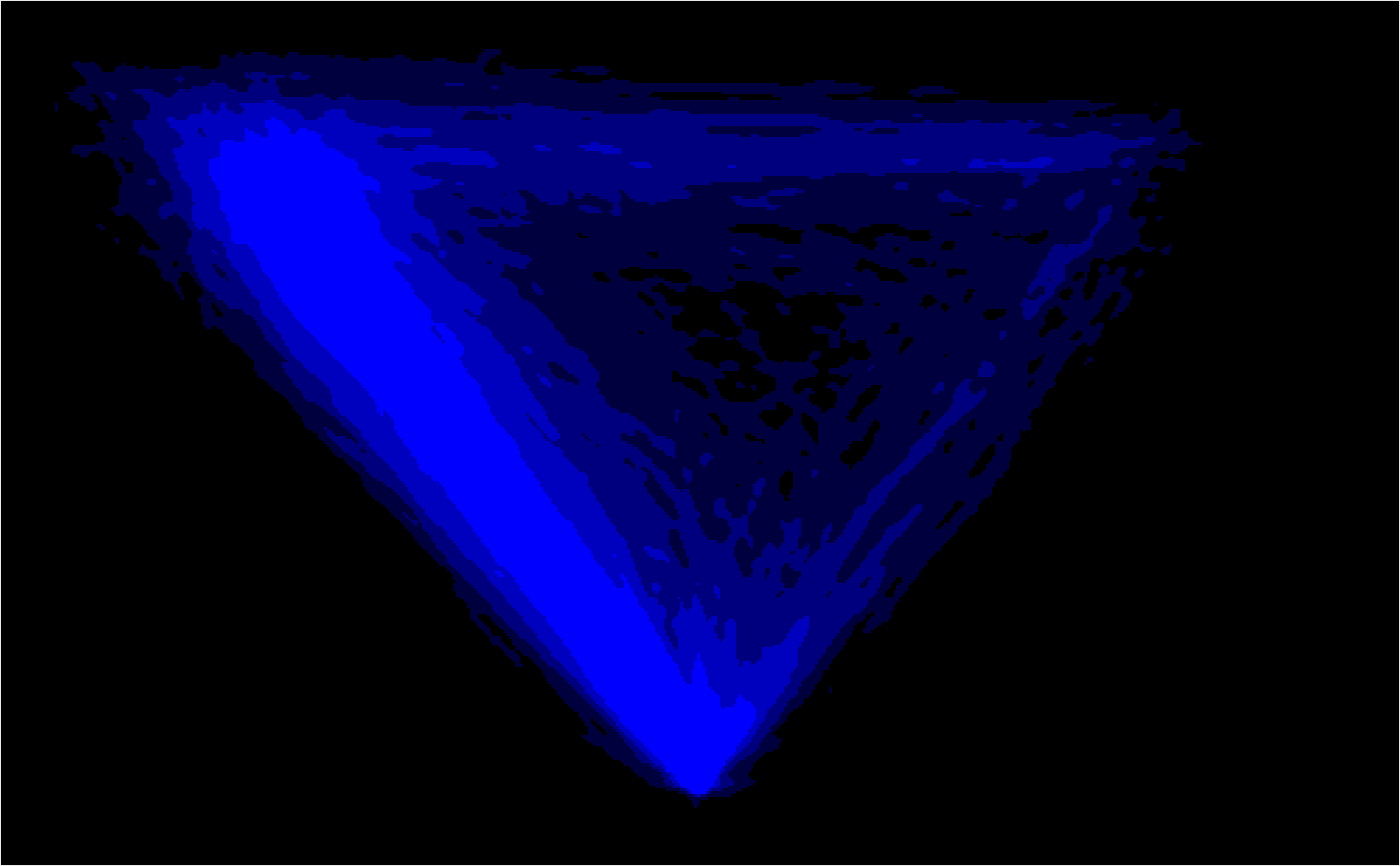
mt_heatmap_ggplot plots high resolution raw trajectory maps. Note that
this function has beta status.
mt_heatmap_ggplot(
  data,
  use = "trajectories",
  dimensions = c("xpos", "ypos"),
  use2 = "data",
  facet_row = NULL,
  facet_col = NULL,
  ...
)
Arguments
- data
a mousetrap data object created using one of the mt_import functions (see mt_example for details). Alternatively, a trajectory array can be provided directly (in this case
usewill be ignored).- use
a character string specifying which trajectory data should be used.
- dimensions
a character vector specifying the trajectory variables used to create the heatmap. The first two entries are used as x and y-coordinates, the third, if provided, will be added as color information.
- use2
an optional character string specifying where the data that contain the variables used for faceting can be found (in case these arguments are specified). Defaults to "data" as
data[["data"]]usually contains all non mouse-tracking trial data.- facet_row
an optional character string specifying a variable in
data[[use2]]that should be used for (row-wise) faceting.- facet_col
an optional character string specifying a variable in
data[[use2]]that should be used for (column-wise) faceting.- ...
arguments passed to mt_heatmap_raw.
Details
mt_heatmap_ggplot wraps mt_heatmap_raw and returns a ggplot
object containing the plot. In contrast to mt_heatmap_plot plots
created by mt_heatmap_ggplot can be extended using ggplot's +
operator. For further details on how the trajectory heatmaps are constructed,
see mt_heatmap_raw.
References
Wulff, D. U., Haslbeck, J. M. B., Kieslich, P. J., Henninger, F., & Schulte-Mecklenbeck, M. (2019). Mouse-tracking: Detecting types in movement trajectories. In M. Schulte-Mecklenbeck, A. Kühberger, & J. G. Johnson (Eds.), A Handbook of Process Tracing Methods (pp. 131-145). New York, NY: Routledge.
Kieslich, P. J., Henninger, F., Wulff, D. U., Haslbeck, J. M. B., & Schulte-Mecklenbeck, M. (2019). Mouse-tracking: A practical guide to implementation and analysis. In M. Schulte-Mecklenbeck, A. Kühberger, & J. G. Johnson (Eds.), A Handbook of Process Tracing Methods (pp. 111-130). New York, NY: Routledge.
See also
mt_heatmap for plotting a trajectory heatmap using base plots.
mt_diffmap for plotting trajectory difference-heatmaps.
Examples
mt_heatmap_ggplot(KH2017, xres=500, n_shades=5, mean_image=0.2)
#> spatializing trajectories
#> calculate image
#> smooth image
#> enhance image by 26.5
#> Warning: Removed 1612 rows containing missing values or values outside the scale range
#> (`geom_tile()`).