mt_plot_add_rect adds one or several rectangles to a mousetrap plot.
These buttons usually correspond to the borders of the buttons in the
mouse-tracking experiment. It is specifically designed so that the arguments
from the mousetrap_response plugin in OpenSesame can be used.
mt_plot_add_rect(rect, color = "black", fill = NA, ...)Arguments
- rect
a data.frame or matrix with one row per box. For each rectangle, the x-position (
x), y-position (y), width (w), and height (h) needs to be provided. If columns are not labeled, the orderx, y, w, his assumed.- color
argument passed on to geom_rect. Specifies the color of the border of the rectangles.
- fill
argument passed on to geom_rect. Specifies the color of the interior of the rectangles. If
NA(the default), rectangles are unfilled.- ...
additional arguments passed on to geom_rect.
Details
mt_plot_add_rect internally uses geom_rect of the
ggplot2 package for plotting.
See also
mt_plot for plotting trajectory data.
Examples
# Load ggplot2
library(ggplot2)
# Import, flip, and time-normalize raw trajectories
mt_example <- mt_import_mousetrap(mt_example_raw)
mt_example <- mt_remap_symmetric(mt_example,remap_xpos="no")
mt_example <- mt_time_normalize(mt_example)
# Create rectangles matrix
rectangles <- matrix(
# (The matrix is n x 4, and contains
# all relevant data for every button,
# (i.e. x, y, width and height values)
# in separate rows)
c(
-840, 525, 350, -170,
840, 525, -350, -170
),
ncol=4, byrow=TRUE)
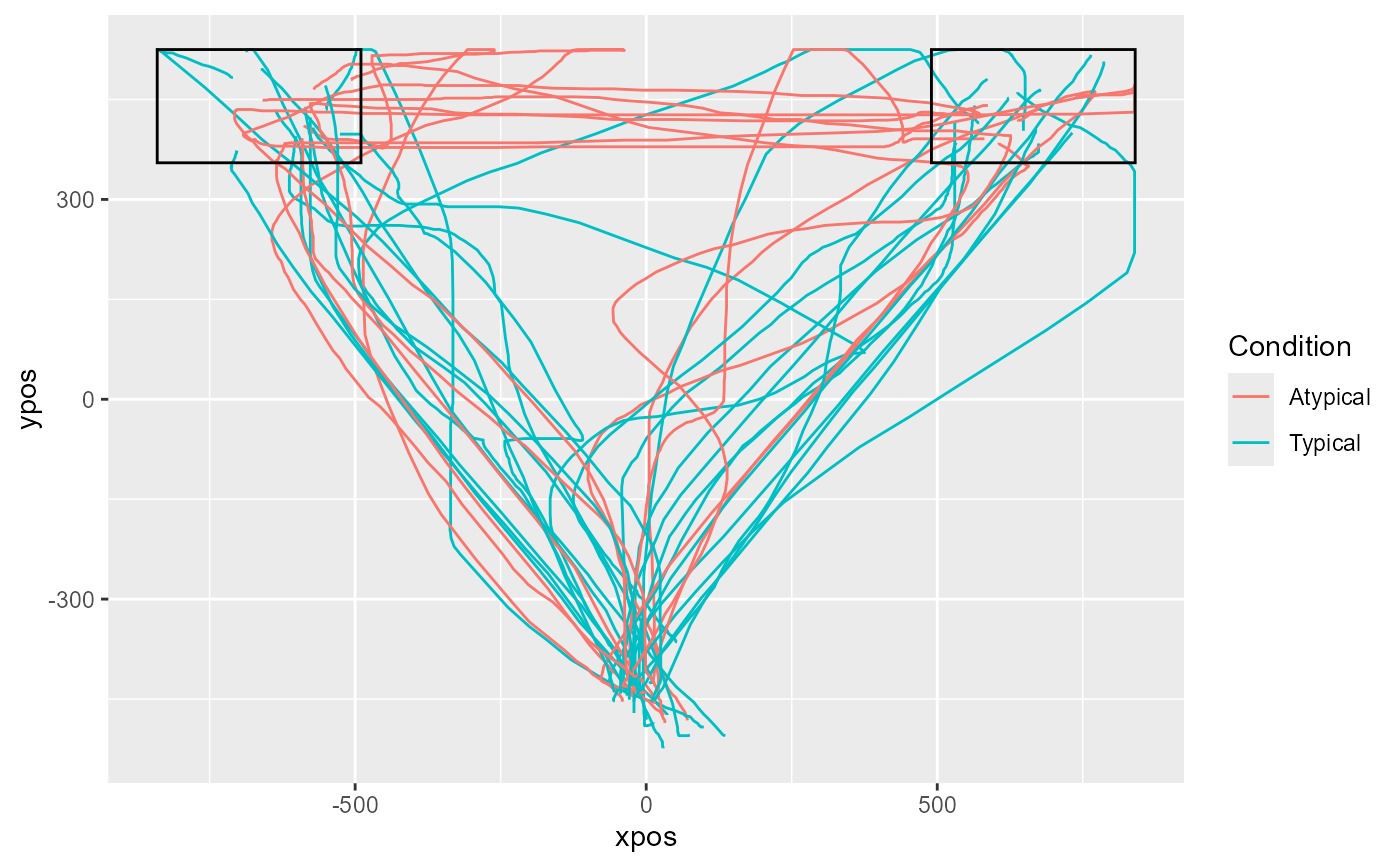
# Plot all time-normalized trajectories
# varying the color depending on the condition
# and add rectangles
mt_plot(mt_example,
use="trajectories",
x="xpos", y="ypos", color="Condition"
) + mt_plot_add_rect(rect=rectangles)